Multiple Choice
Exhibit
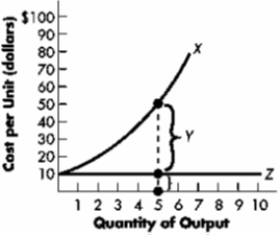
-Refer to Exhibit. The distance Y between the two curves in the diagram is:
A) the total cost of producing five units of output.
B) the total variable cost of producing five units of output.
C) the total fixed cost of producing five units of output.
D) the average variable cost of producing five units of output.
Correct Answer:
Verified
Related Questions

