Using the Loan Amortization Chart To access this chart, go to the Student Edition of the textbook's Online Learning Centre. In the navigation bar, select "Chapter 14" in the drop-down box. In the list of resources for Chapter 14, select "Links in Textbook" and then click on the link named "Mortgage Payoff Chart." Over the full amortization period, the chart plots graphs of both the mortgage balance and the cumulative interest paid. Note the "Definitions" section below the chart.
You can select from a variety of accelerated payment and prepayment options. If you enter a nonzero "Prepayment amount", the chart presents additional graphs for the balance and cumulative interest under the prepayment plan. (Round prepayment amounts to the nearest dollar before entry.) These graphs enable you to see how much the prepayments reduce both the cumulative interest cost and the time required to pay off the loan. Use this chart ( and its associated report) to answer the following problems.
In Parts (b) through (f), round the answer to the nearest 0.1 year. Also note that the reduction (referred to as "savings") in the total interest paid is over the life of the loan.
A $100,000 mortgage loan at 7.2% compounded semiannually requires monthly payments based on a 25- year amortization. Assuming that the interest rate does not change for the entire 25 years, complete the following table. 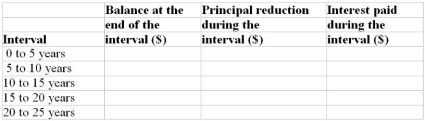
Correct Answer:
Verified
Q39: A $100,000 mortgage at 7.1% compounded semiannually
Q40: Monthly payments on a $150,000 mortgage are
Q41: The MacLellans originally chose to make payments
Q42: The monthly payments on the Wolskis' $166,000
Q43: A marketing innovation is the "cash-back mortgage"
Q45: A $200,000 mortgage at 6.6% compounded semiannually
Q46: A $100,000 mortgage at 6.8% compounded semiannually
Q47: The Gills have arranged a second mortgage
Q48: A mortgage loan having a face value
Q49: A borrower has arranged a $105,000 face
Unlock this Answer For Free Now!
View this answer and more for free by performing one of the following actions

Scan the QR code to install the App and get 2 free unlocks

Unlock quizzes for free by uploading documents