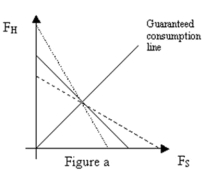
-Refer to Figure a. Assuming the bold line in the graph above is a constant expected consumption line where  , which constant expected consumption line reflects an increase in
  ?
?
A) Dotted line
B) Dashed line
C) An increase in  does not result in an change in the expected consumption line
D) A change in  results in a parallel shift in the expected consumption line, so neither the red or green line reflects this change
Correct Answer:
Verified
Q1: The hot-hand fallacy
A) Is the belief that
Q2: Q3: What is the expected payoff of an Q4: What is the standard deviation of the Q5: What is the expected payoff of an![]()
Unlock this Answer For Free Now!
View this answer and more for free by performing one of the following actions

Scan the QR code to install the App and get 2 free unlocks

Unlock quizzes for free by uploading documents