Multiple Choice
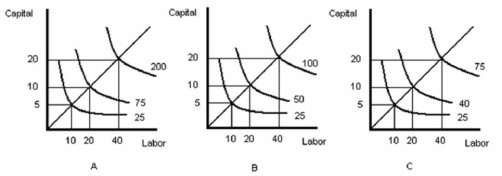
-Refer to Figure above. Which graph represents decreasing returns to scale?
A) A
B) B
C) C
D) Both graph A and graph C
Correct Answer:
Verified
Related Questions
Q3: Which of the following is the formula
Q4: When labour inputs are finely divisible, the
Q5: Which of the following is NOT a
Q6: Suppose that the marginal product of a
Unlock this Answer For Free Now!
View this answer and more for free by performing one of the following actions

Scan the QR code to install the App and get 2 free unlocks

Unlock quizzes for free by uploading documents