Multiple Choice
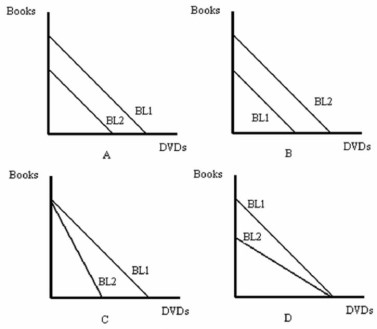
-Refer to Figure above. Which graph represents an increase in the consumer's income?
A) A
B) B
C) C
D) D
Correct Answer:
Verified
Related Questions
Q4: The effect of a compensated price change
Q5: Which of the following does NOT describe

