Draw a normal curve with ? = 60 and ? = 10. Label the mean and the inflection points.
A) 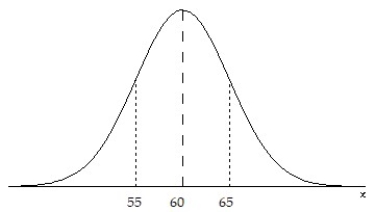
B) 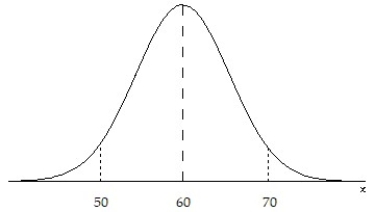
C) 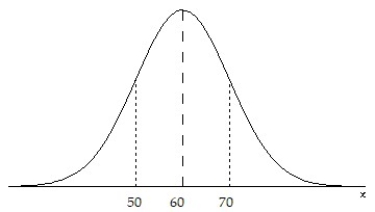
D) 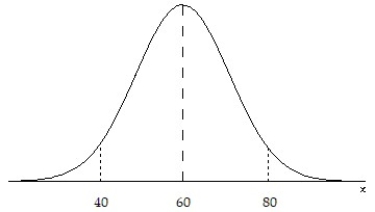
Correct Answer:
Verified
Q1: High temperatures in a certain city for
Q2: Compare a graph of the normal density
Q3: Compare a graph of the normal density
Q5: You are performing a study about the
Q6: The graph of a normal curve is
Q7: Determine whether the graph can represent a
Q8: Determine whether the graph can represent a
Q9: Determine whether the graph can represent a
Q10: Determine whether the graph can represent a
Q11: The analytic scores on a standardized aptitude
Unlock this Answer For Free Now!
View this answer and more for free by performing one of the following actions

Scan the QR code to install the App and get 2 free unlocks

Unlock quizzes for free by uploading documents