You are performing a study about the weight of preschoolers. A previous study found the weights to be normally distributed with a mean of 30 and a standard deviation of 4. You randomly sample 30 preschool children and find their weights to be as follows. 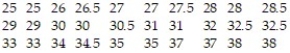 a) Draw a histogram to display the data. Is it reasonable to assume that the weights are normallydistributed? Why?
b) Find the mean and standard deviation of your sample.
c) Is there a high probability that the mean and standard deviation of your sample are consistentwith those found in previous studies? Explain your reasoning.
Correct Answer:
Verified
View Answer
Unlock this answer now
Get Access to more Verified Answers free of charge
Q1: High temperatures in a certain city for
Q2: Compare a graph of the normal density
Q3: Compare a graph of the normal density
Q4: Draw a normal curve with ? =
Q6: The graph of a normal curve is
Q7: Determine whether the graph can represent a
Q8: Determine whether the graph can represent a
Q9: Determine whether the graph can represent a
Q10: Determine whether the graph can represent a
Q11: The analytic scores on a standardized aptitude
Unlock this Answer For Free Now!
View this answer and more for free by performing one of the following actions

Scan the QR code to install the App and get 2 free unlocks

Unlock quizzes for free by uploading documents