Which of the following is most likely to match the shape of the distribution of heights among teachers and students at a large elementary school?
A) 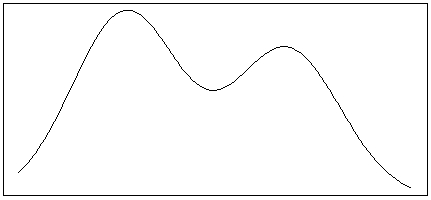
B) 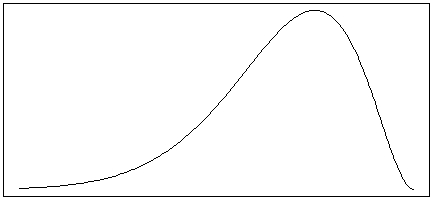
C) 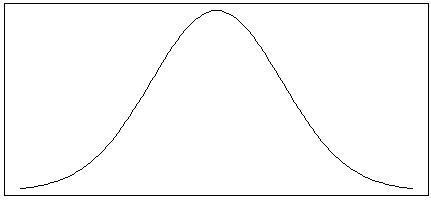
D) 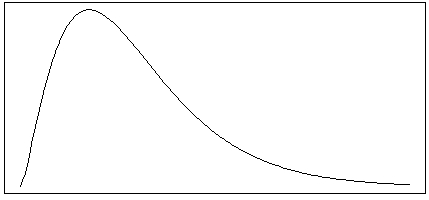
Correct Answer:
Verified
Q25: A histogram of a bootstrapped null distribution
Q26: The following histogram shows the distribution of
Q27: The following histogram shows the distribution of
Q28: The following histogram shows the distribution of
Q29: The following histogram shows the distribution of
Q31: If a distribution is skewed left, then
Q32: Most experts recommend college students get at
Q33: Most experts recommend college students get at
Q34: Most experts recommend college students get at
Q35: Most experts recommend college students get at
Unlock this Answer For Free Now!
View this answer and more for free by performing one of the following actions

Scan the QR code to install the App and get 2 free unlocks

Unlock quizzes for free by uploading documents