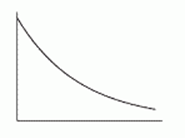
The quantity of the drug in a patient's bloodstream increased at a decreasing rate until it reached saturation. Which of the following graphs shows the quantity of drug in the blood graphed against time?
A) 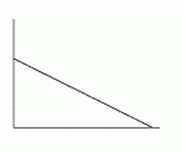
B) 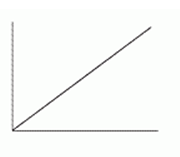
C)
D) 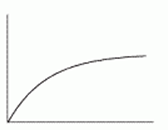
E) 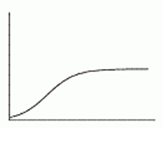
F) 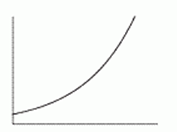
Correct Answer:
Verified
Q3: Which scenario below best matches the following
Q4: Calculate successive rates of change for the
Q5: Calculate successive rates of change for the
Q6: Does the following figure appear to be
Q7: Does the graph of 
Q9: The rumor spread slowly--then faster--then slowly again.
Q10: Determine the concavity of the graph of
Q11: The car slowed down steadily. Which of
Q12: Sketch a graph of Q13: Graph ![]()
![]()
Unlock this Answer For Free Now!
View this answer and more for free by performing one of the following actions

Scan the QR code to install the App and get 2 free unlocks

Unlock quizzes for free by uploading documents