Short Answer
The data points for the following table are graphed in the figure below. 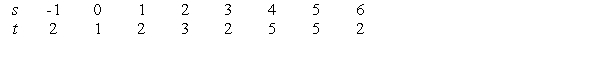
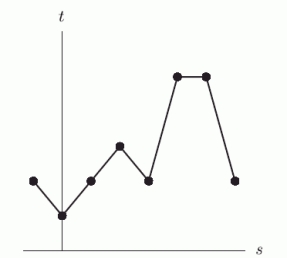
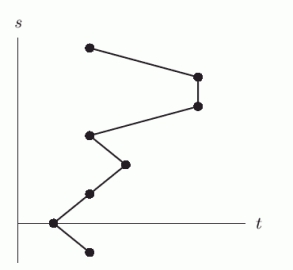
For the graph that is a function, approximate  .
.
Correct Answer:
Verified
Related Questions
The data points for the following table are graphed in the figure below.
For the graph that is a function, approximate .
Correct Answer:
Verified

