Several years ago, the wild rabbits of Australia were seriously threatened by a virus that was accidentally released into their population. Suppose that the following table gives the number r of rabbits (in millions) remaining t months after the release of the virus.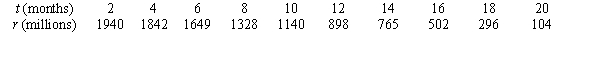
- Use a calculator program to find the regression line for this data. What is the physical interpretation of the t-intercept?
A) The decrease in the population if the virus is present an additional month.
B) The number of months the virus took to lower the population by 1 milllion.
C) The initial rabbit population when the virus was introduced.
D) The time in months at which the rabbit population falls to zero.
Correct Answer:
Verified
Q1: Several years ago, the wild rabbits of
Q2: Several years ago, the wild rabbits of
Q4: A study was done that collected data
Q5: The following figure gives the annual amount
Q6: The following table shows the cost of
Q7: The following table shows the cost of
Q8: The following figure shows scatter plots with
Q9: The following table gives the number P
Q10: The following table gives the number P
Q11: The following table shows the size of
Unlock this Answer For Free Now!
View this answer and more for free by performing one of the following actions

Scan the QR code to install the App and get 2 free unlocks

Unlock quizzes for free by uploading documents