The following table shows the enrollment in a private college for the years 1996 to 2005. Interpret these figures as partial sums,  , of terms of a sequence,
 , where n is the number of years since 1995 (so
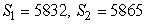 , etc.) .
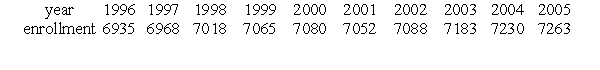 Which of the following gives the change in enrollment between 1997 and 1998?
A) 
B) 
C) 
D) 
Correct Answer:
Verified
Q38: The population of Arizona rose from 5,130,635
Q39: The population of Arizona rose from 5,130,635
Q40: Does Q41: Does Q42: What is the sum of the first Q44: The following table shows the enrollment in Q45: The following table shows the enrollment in Q46: The following table shows the enrollment in Q47: A person decides to walk for 15 Q48: Does Unlock this Answer For Free Now! View this answer and more for free by performing one of the following actions Scan the QR code to install the App and get 2 free unlocks Unlock quizzes for free by uploading documents![]()
![]()
![]()

