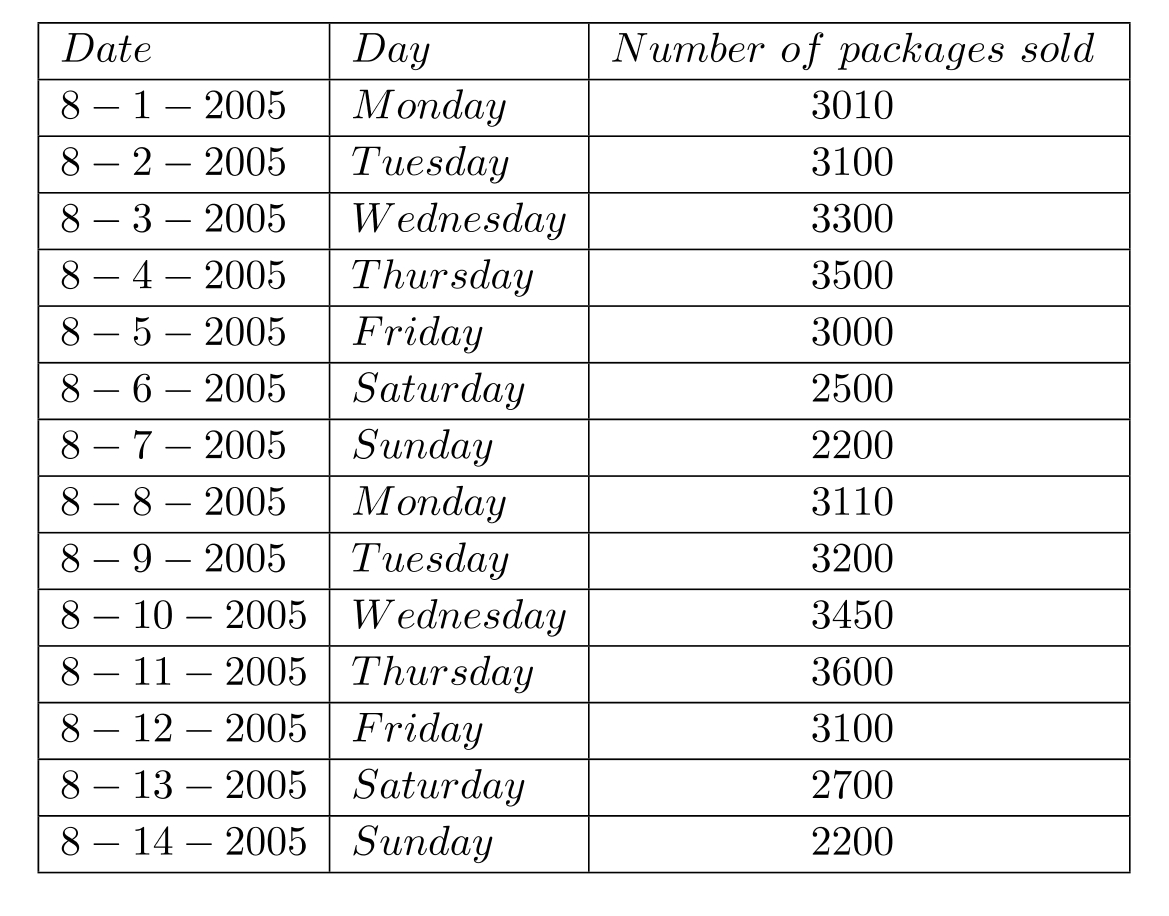
Demand data for number of packed food sold by Advanced Airlines on each day of the first two weeks of August 2005 is given in the table below.
(A) Using the centered moving average method, generate a set of centered moving averages using , the number of periods set to 3 .
(B) Fit a trend line for the centered moving average data, using for 8-1-2005.
(C) Estimate seasonal index Monday.
(D) Make a seasonally adjusted trend line forecast for 8-15-2005.
Correct Answer:
Verified
(B) Trend line...
View Answer
Unlock this answer now
Get Access to more Verified Answers free of charge
Q65: A group of garden enthusiasts are
Q66: If the slope of the linear
Q67: A multiple regression line between mid
Q68: MAD and MSE for a given set
Q69: Tracking signal
A) will always be positive
B) will
Q70: If several consecutive values of tracking signal
Q71: Demand data for number of packed
Q73: Data collected from a random set
Q74: Calculate the forecast accuracy measures such as
Q75: The data regarding cost and related
Unlock this Answer For Free Now!
View this answer and more for free by performing one of the following actions

Scan the QR code to install the App and get 2 free unlocks

Unlock quizzes for free by uploading documents