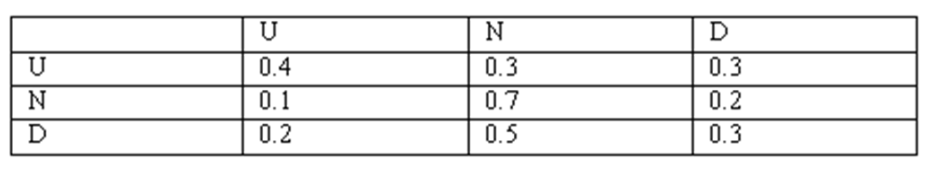
Goldman Sachs commodity analyst John Roberts wanted to use Markov Chains to analyze the price movement of gold. He looked at the changes in the closing price per ounce of gold bullion in the Chicago Board of Trade for any two consecutive trading days. He recognized three states: U (up): today's closing price - previous closing price (neutral): today's closing price - previous closing price ; and D (down): today's closing price - previous closing price . John goes on to construct a transition matrix based on these state definitions; the matrix is given below.
(A) Draw a tree diagram showing the choices for two periods, starting from and .
(B) If the current state of the bullion market were , what would be the probability distribution for the states occupied by the bullion market after 2 trading days?
(C) What would be the long-run proportions (steady-state probabilities) for each state?
(D) In a five-year period with 1,201 trading days, how many of these days would you expect the system to be in U state?
Correct Answer:
Verified
View Answer
Unlock this answer now
Get Access to more Verified Answers free of charge
Q42: Newsweek and Time are two competing
Q43: Newsweek and Time are two competing
Q44: Newsweek and Time are two competing
Q45: XYZ Inc. hires only retired people
Q46: XYZ Inc. hires only retired people
Q47: XYZ Inc. hires only retired people
Q48: XYZ Inc. hires only retired people for
Q49: XYZ Inc. hires only retired people
Q50: XYZ Inc. hires only retired people
Q52: The U.S. army hires only newly
Unlock this Answer For Free Now!
View this answer and more for free by performing one of the following actions

Scan the QR code to install the App and get 2 free unlocks

Unlock quizzes for free by uploading documents