Multiple Choice
Figure 1A.1 : 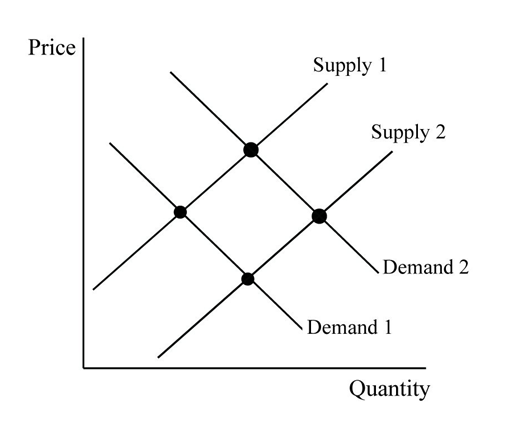
-Refer to Figure 1A.1. Assume that the graph in this figure represents the demand and supply curves for used cars, which are inferior goods. An increase in income would be represented by a shift from
A) Demand 1 to Demand 2.
B) Demand 2 to Demand 1.
C) Supply 1 to Supply 2.
D) Supply 2 to Supply 1.
Correct Answer:
Verified
Related Questions
Q82: If a product is a normal good,
Q83: All of the following are factors that

