The following diagram shows the foreign exchange market for sterling.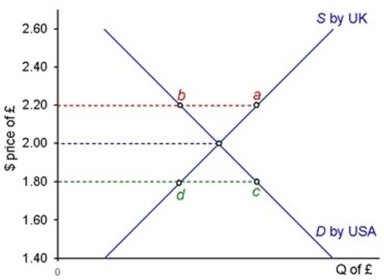 At an exchange rate of $2.20 there is
A) a shortage of pounds of a- b.
B) an excess supply of pounds of a- b.
C) an overvalued exchange rate of 40 cents.
D) an excess demand for dollars of c- d.
Correct Answer:
Verified
Q15: Under a system of floating exchange rates,
Q16: All currencies other than the domestic currency
Q17: The supply curve for sterling on the
Q18: Which of the following would not shift
Q19: When the exchange rate falls this is
Q21: The following diagram shows the foreign exchange
Q22: The demand for pounds in the foreign
Q23: If the inflation rate falls in the
Q24: If the UK receives larger than expected
Q25: If there is a current account deficit
Unlock this Answer For Free Now!
View this answer and more for free by performing one of the following actions

Scan the QR code to install the App and get 2 free unlocks

Unlock quizzes for free by uploading documents