Multiple Choice
What does the figure illustrate? 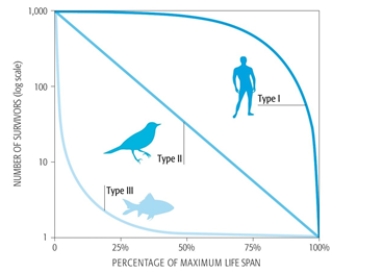
A) Fish have a steady rate of mortality change.
B) Birds have a constant mortality rate.
C) Humans have an increased mortality rate at a young age.
D) Fish have a decreased mortality rate at young age.
E) Birds have an ever decreasing mortality rate.
Correct Answer:
Verified
Related Questions
Q21: Which of the following is an example
Q22: How does generation time affect population growth
Q23: At fertilization, the egg and the sperm
Q24: If a population of lemmings grows fast
Q25: Use the pictures to determine what type
Unlock this Answer For Free Now!
View this answer and more for free by performing one of the following actions

Scan the QR code to install the App and get 2 free unlocks

Unlock quizzes for free by uploading documents