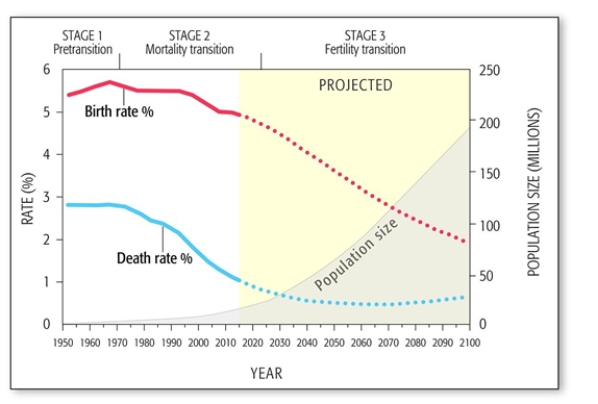
-According to this figure depicting Niger's population, when did the country enter the second stage of the demographic transition?
A) 1950- 1960
B) 1990- 2000
C) 1975- 1980
D) 2000- 2010
E) 1960- 1970
Correct Answer:
Verified
Q57: Within a country, push factors are conditions
Q58: In Latin America from 1600 to 1900
Q59: Globally, what is the main reason that
Q60: In using the IPAT equation, much of
Q61: The infant mortality rate is the percentage
Q63: According to this figure depicting Niger's population
Q64: In the early stages of fertility transition,
Q65: Based on information in this figure on
Q66: Match the following terms with the correct
Q67: Match the following terms with the correct
Unlock this Answer For Free Now!
View this answer and more for free by performing one of the following actions

Scan the QR code to install the App and get 2 free unlocks

Unlock quizzes for free by uploading documents