Figure 9-3
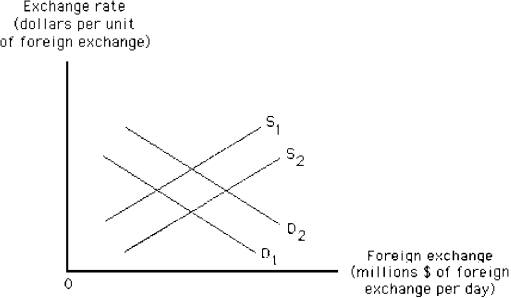
-Suppose that U.S.tastes for British goods increase.Then,in Figure 9-3
A) the supply curve shifts from S₁ to S₂
B) the supply curve shifts from S₂ to S₁
C) the demand curve shifts from D₂ to D₁
D) the demand curve shifts from D₁ to D₂
E) both demand and supply shift to the right
Correct Answer:
Verified
Q201: Use the figure below to answer the
Q202: Use the figure below to answer the
Q203: Use the figure below to answer the
Q204: If the expected rate of inflation is
Q206: The circular flow of income is coordinated
Q208: As prices rise,a fixed money supply will
Q209: Use the figure below to answer the
Q210: Within the aggregate demand/aggregate supply framework,the quantity
Q212: Use the figure below to answer the
Q218: Use the figure below to answer the
Unlock this Answer For Free Now!
View this answer and more for free by performing one of the following actions

Scan the QR code to install the App and get 2 free unlocks

Unlock quizzes for free by uploading documents