Figure 15-3
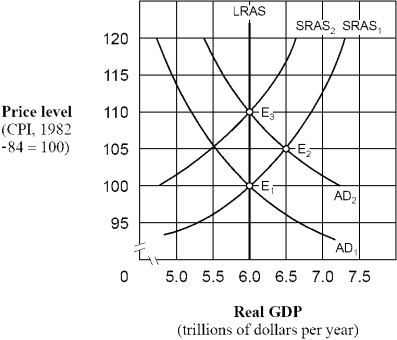
-As shown in Figure 15-3,if people behave according to adaptive expectations theory,an increase in the aggregate demand curve from AD₁ to AD₂ will cause
A) labor to adjust nominal wages sluggishly.
B) the aggregate supply curve to shift from SRAS₁ to SRAS₂
C) the price level to eventually rise from 100 to 110.
D) All of the above.
Correct Answer:
Verified
Q96: Which of the following contributed the most
Q121: Figure 15-3 Q122: Use the table below to choose the Q123: During the 1960s,most economists believed macropolicy Q124: The modern view of the Phillips curve Q126: Use the figure below to answer the Q127: Use the figure below to answer the
![]()
A)that caused
Unlock this Answer For Free Now!
View this answer and more for free by performing one of the following actions

Scan the QR code to install the App and get 2 free unlocks

Unlock quizzes for free by uploading documents