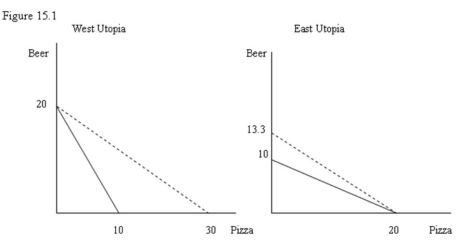
-Refer to Figure 15.1. The solid lines are production possibilities curves; the dashed lines are consumption possibilities curves. The data contained in the production possibilities curves are based on the assumption of:
A) imperfect shiftability of resources as between beer and pizza production.
B) constant costs.
C) decreasing costs.
D) increasing costs.
Correct Answer:
Verified
Q24: Table 15.2 Costs, prices and exchange rates
Q25: Table 15.2 Costs, prices and exchange rates
Q26: Table 15.3 Costs of producing wine and
Q27: Table 15.3 Costs of producing wine and
Q28: The level of the equilibrium exchange rate
Unlock this Answer For Free Now!
View this answer and more for free by performing one of the following actions

Scan the QR code to install the App and get 2 free unlocks

Unlock quizzes for free by uploading documents