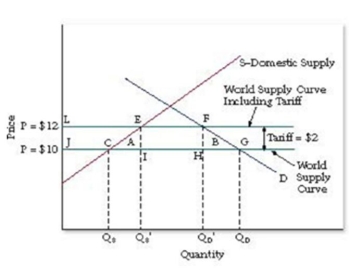
-Refer to Figure 15.2. The diagram shows that the effect of the tariff was:
A) to raise domestic production from QS to QS' with no effect on total purchases.
B) to lower domestic production from QS' to QS and raise imports from QS' to QD.
C) to raise prices, lower total consumption to QD' and raise domestic production to QS'.
D) to lower prices and increase total consumption to QD based on higher domestic production.
Correct Answer:
Verified
Q55: To protect the competitiveness of domestic industries,
Q56: Beginning with a free trade equilibrium and
Q57: Suppose Canada eliminates tariffs on Chinese bicycles.
Q58: Q59: Q61: Q62: The imposition of a tariff causes consumption Q63: A tariff causes domestic firms to _ Q64: If, as a result of trade policy, Q65: Unlock this Answer For Free Now! View this answer and more for free by performing one of the following actions Scan the QR code to install the App and get 2 free unlocks Unlock quizzes for free by uploading documents![]()
![]()
![]()
![]()

