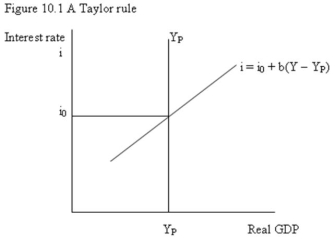
-Refer to Figure 10.1. The diagram shows that:
A) when real GDP is lower than YP the central bank will raise interest rates above i0.
B) when real GDP is lower than YP the central bank will reduce money supply.
C) when real GDP is higher than YP the central bank will raise interest rates above i0.
D) when real GDP is higher than YP the central bank will increase money supply.
Correct Answer:
Verified
Q76: By transferring government deposits between accounts in
Q77: Interest rates are adjusted as part of
Q78: Based on a Taylor rule, which of
Q79: Which of the following statements is false
Q80: If a central bank does not follow
Q82: A _ policy rule specifies how the
Q83: Most central banks have abandoned the _
Q84: Changes in _, by changing interest rates
Q85: Monetary policy is expected to influence output
Q86: In the short run, if the Bank
Unlock this Answer For Free Now!
View this answer and more for free by performing one of the following actions

Scan the QR code to install the App and get 2 free unlocks

Unlock quizzes for free by uploading documents