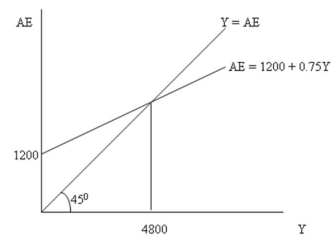
Consider the following aggregate expenditure model diagram:
 For each of the following, draw a graph to show what would happen to the equilibrium level of income in the economy.
(a) Business optimism about future markets improves resulting in an increase in autonomous investment of 100.
(b) Foreign economic activity falls, which results in a fall in autonomous exports of 50.
(c) In response to a rising public debt ratio governments raise the net tax rate, which lowers the slope of the AE function from 0.75 to 0.66.
Correct Answer:
Verified
View Answer
Unlock this answer now
Get Access to more Verified Answers free of charge
Q121: The equilibrium condition for an open economy
Q122: The actual budget balance may be a
Q123: A fall in the government budget balance
Q124: The actual and structural budget balances will
Q125: The structural budget balance measures what the
Q126: Answer parts (a) - (e) below based
Q127: The MPC for a closed economy is
Q128: Suppose the aggregate expenditure model is
C =
Q130: What is discretionary countercyclical fiscal policy?
Q131: Use diagrams to show how an increase
Unlock this Answer For Free Now!
View this answer and more for free by performing one of the following actions

Scan the QR code to install the App and get 2 free unlocks

Unlock quizzes for free by uploading documents