The monthly sales of hybrid cars in the United States for the first 8 months of a recent year are shown in the graph. The line is the best fit model for this data. Use the given two data points to write a linear function for this data. 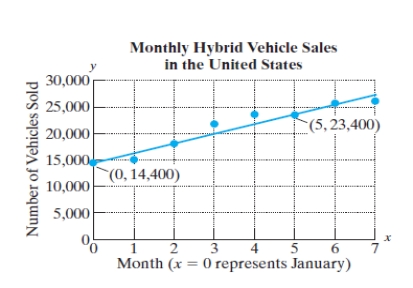
A) 
B) 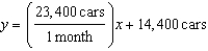
C) 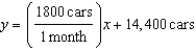
D) 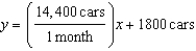
E) none of these
Correct Answer:
Verified
Q37: A 16-inch candle burns at a rate
Q38: A 16-inch candle burns at a rate
Q39: A 16-inch candle burns at a rate
Q40: A truck has a 62-gallon gas tank.
Q41: A truck has a 62-gallon gas tank.
Q43: Major League Baseball has a labor agreement
Q44: A rancher has a 5000-gallon water tank
Q45: A rancher has a 5000-gallon water tank
Q46: Use the quadratic function n 
Q47: Use the quadratic function n
Unlock this Answer For Free Now!
View this answer and more for free by performing one of the following actions

Scan the QR code to install the App and get 2 free unlocks

Unlock quizzes for free by uploading documents