Given the graph shown below, what is the variable cost per unit to be used in the cost equation for the line at 400 units? 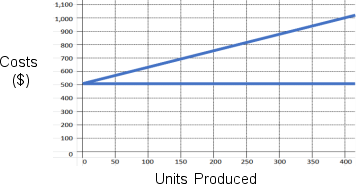
A) $1.00
B) $1.25
C) $2.00
D) $2.25
Correct Answer:
Verified
Q25: Use of a scatter-plot
A) mitigates the risk
Q26: Visualizing data on a scatter-plot
A) requires the
Q27: In creating a scatter plot using Excel,
Q28: A leak in the roof ruined part
Q29: DMX anticipates producing 500 license plates during
Q31: Anwar Industries has the following activity and
Q32: The regression method
A) uses only two actual
Q33: The "line of best fit" created in
Q34: In graphing the "line of best fit"
Q35: What is the common goal of the
Unlock this Answer For Free Now!
View this answer and more for free by performing one of the following actions

Scan the QR code to install the App and get 2 free unlocks

Unlock quizzes for free by uploading documents