Jeweltopia is a trendy online jewelry boutique that completed its first year of operations. Management would like to conduct some data analysis to take a detailed look at various business activities. Jill, the sales head, is concerned that their sales have not met their budgeted sales every month. Analysts collected the following data: 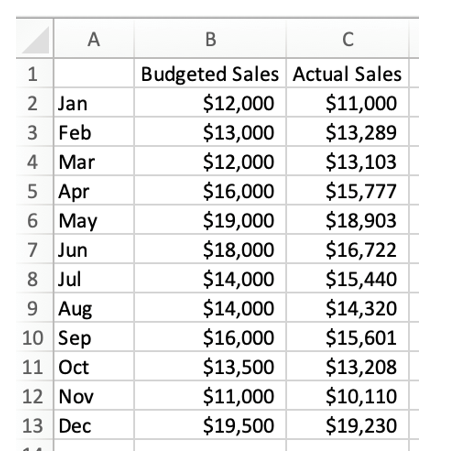 Jill decided to analyze his data and create some visuals to assist during the presentation of her findings to management. With all this in mind, please answer the following questions.
a. Using Excel, determine sales variances for each month. Also, determine if the Jeweltopia had favorable or unfavorable sales variance for the year as a whole.
b. Jill would like to create visual aids to depict this data in a way. What kind of graph would you create for Jill and why? Using Excel, create this graph.
c. Based on your answers to parts a) and b), do you believe Jill's concerns are warranted? What would you recommend Jill do about their budgeting or current sales figures?
Correct Answer:
Verified
View Answer
Unlock this answer now
Get Access to more Verified Answers free of charge
Q129: Artemis Inc. is a major producer of
Q130: Tara is a cost accountant for Jameson's
Q131: Samantha is a Human Resource Associate for
Q132: Phoebe started her first job out of
Q133: Larry is the owner and operator of
Q135: Wally's Window Emporium is a leading producer
Q136: Wally's Window Emporium is a leading producer
Q137: Chocolate Delights Company manufactures gourmet chocolate candy
Q138: Chocolate Delights Company manufactures gourmet chocolate candy
Q139: Starling Corporation completed their fifth year of
Unlock this Answer For Free Now!
View this answer and more for free by performing one of the following actions

Scan the QR code to install the App and get 2 free unlocks

Unlock quizzes for free by uploading documents