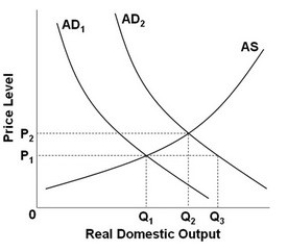
- Refer to the above diagram. When AD1 shifts to AD2, real output:
A) increases from Q1 to Q2, while the price level stays the same.
B) increases from Q1 to Q3, while the price level declines.
C) increases from Q1 to Q2, while the price level rises.
D) stays the same, while the price level rises.
Correct Answer:
Verified
Q32: A graph of the long-run aggregate supply
Q33: Q34: Q35: The table shows the aggregate demand and Q36: Q38: The massive increase in government spending during Q39: One reason why the aggregate supply curve Q40: Other things being equal, a reorganization of Q41: Q42: Unlock this Answer For Free Now! View this answer and more for free by performing one of the following actions Scan the QR code to install the App and get 2 free unlocks Unlock quizzes for free by uploading documents![]()
![]()
![]()
![]()
![]()

