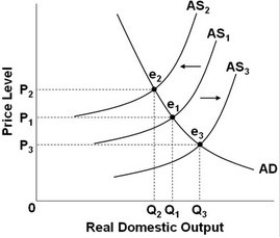
-Refer to the above diagram. Cost-push inflation can be illustrated by a:
A) shift in the aggregate supply curve from AS1 to AS2.
B) shift in the aggregate supply curve from AS1 to AS3.
C) shift in the aggregate supply curve from AS2 to AS3.
D) movement along the aggregate demand curve from e1 to e3.
Correct Answer:
Verified
Q38: The massive increase in government spending during
Q39: One reason why the aggregate supply curve
Q40: Other things being equal, a reorganization of
Q41: Q42: Q44: When aggregate demand decreases, product prices, wage Q45: The ratchet effect means that: Unlock this Answer For Free Now! View this answer and more for free by performing one of the following actions Scan the QR code to install the App and get 2 free unlocks Unlock quizzes for free by uploading documents![]()
![]()
A) when aggregate

