Multiple Choice
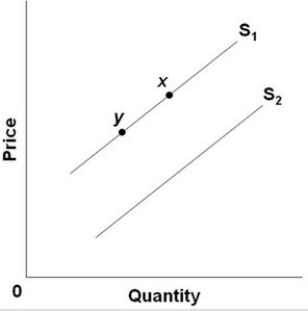 Refer to the above diagram for good R. A shift in the supply curve from S2 to S1 would best be explained by:
A) government imposing a tax on good R.
B) a decrease in the price of resources used to produce good R.
C) an increase in the price of good R.
D) an improvement in the technology used to produce good R.
Correct Answer:
Verified
Related Questions

