Multiple Choice
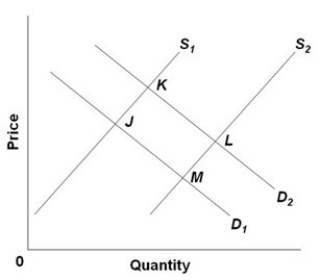
- Refer to the above diagram, in which S1 and D1 represent the original supply and demand curves and S2 and D2 the new curves. In this market:
A) the equilibrium position has shifted from M to K.
B) an increase in demand has been more than offset by an increase in supply.
C) the new equilibrium price and quantity are both greater than they were originally.
D) point M shows the new equilibrium position.
Correct Answer:
Verified
Related Questions

