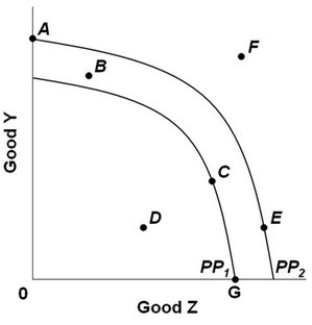
 The graph above shows two production possibilities curves for a nation that produces two goods, Y and Z. PP1 and PP2 show the production possibilities for years 1 and 2. The nation's total production then decreased after year 2. This change could be represented by a move from:
A) F to A.
B) A to E.
C) F to B.
D) E to D.
Correct Answer:
Verified
Q11: A point on the frontier of the
Q12: A movement along the production possibilities curve
Q13: If an economy is producing at a
Q14: If an economy that produces capital and
Q15: Assume that for Indy, one hour of
Q16: Which statement is an economic rationale for
Unlock this Answer For Free Now!
View this answer and more for free by performing one of the following actions

Scan the QR code to install the App and get 2 free unlocks

Unlock quizzes for free by uploading documents