Which of the following graphs describes the relationship between rate and time for a first-order reaction?
A) 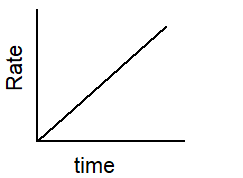
B) 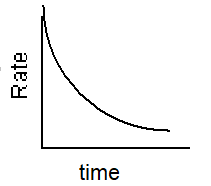
C) 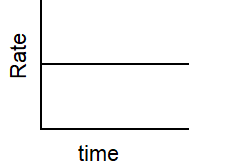
D) 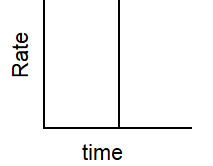
E) 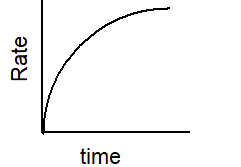
Correct Answer:
Verified
Q40: refer to the reaction
Cr2O72-(aq) + 6
Q41: A certain substance, initially at 0.10 M
Q42: The reaction A
Q43: The half-life for the first-order decomposition
Q44: For the reaction in the above question,
Q46: Which plot best describe the rate
Q47: A certain second-order reaction is found to
Q48: Which of the following statements about the
Q49: For a second-order reaction, it takes 15
Q50: The rate constant, k, for the first-order
Unlock this Answer For Free Now!
View this answer and more for free by performing one of the following actions

Scan the QR code to install the App and get 2 free unlocks

Unlock quizzes for free by uploading documents