Which of the following graphs best represents the relationship between the concentration of reactants and products with respect to time for the following chemical reaction?
2 H2(g) + O2(g)  2 H2O(g)
A) 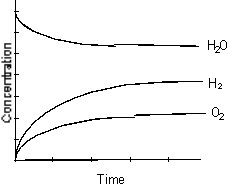
B) 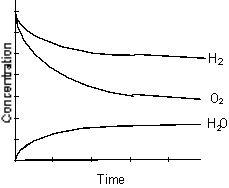
C) 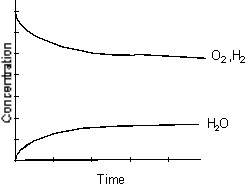
D) 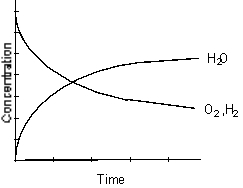
E) 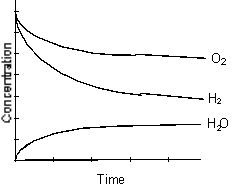
Correct Answer:
Verified
Q9: For the following reaction:
2 NOCl(g) 
Q10: Which one of the following graphs best
Q11: Use the following graph for answering
Q12: Use the following graph for answering
Q13: At equilibrium, _.
A) all chemical processes
Q15: Assume that the equilibrium constants for the
Q16: Which is the correct equilibrium constant expression
Q17: Assume that the equilibrium constant for the
Q18: For the reaction shown below, at equilibrium
I2(g)
Q19: Based on the information given in the
Unlock this Answer For Free Now!
View this answer and more for free by performing one of the following actions

Scan the QR code to install the App and get 2 free unlocks

Unlock quizzes for free by uploading documents