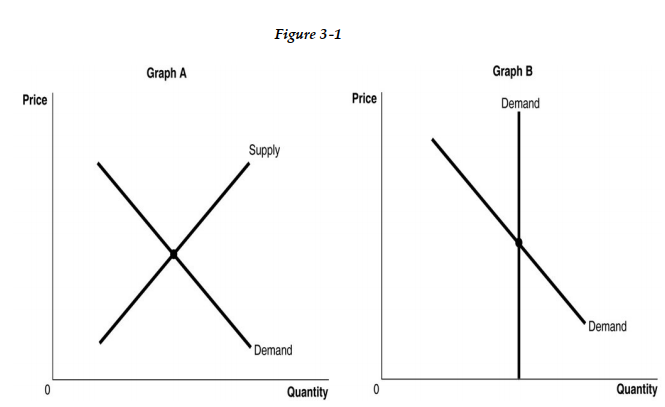
-Refer to Figure 3 -1. The figure above shows the supply and demand curves for two markets: the market for original Picasso paintings, and the market for designer jeans. Which graph most likely represents which market?
A) Graph B represents the market for original Picasso paintings and Graph A represents the market for designer jeans.
B) Graph B represents both the market for original Picasso paintings and designer jeans.
C) Graph A represents the market for original Picasso paintings and Graph B represents the market for designer jeans.
D) Graph A represents both the market for original Picasso paintings and designer jeans.
Correct Answer:
Verified
Q5: Google launched Ahlan Online
A) in response to
Q6: In 2002, Apple decided not to develop
Q7: In 2002, Apple decided not to develop
Q8: What is the difference between an "increase
Q9: Mazin subscribes to a monthly pest control
Q11: Assume there is a shortage in the
Unlock this Answer For Free Now!
View this answer and more for free by performing one of the following actions

Scan the QR code to install the App and get 2 free unlocks

Unlock quizzes for free by uploading documents