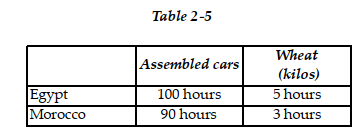
-Refer to Table 2-5. This table shows the number of labor hours required to produce an assembled car and a kilo of wheat in Egypt and Morocco.
a. If each country has a total of 9,000 labor hours to devote to the production of the two goods, draw the production possibilities frontier for each country. Put "Assembled cars" on the horizontal axis and "Wheat (kilos)" on the vertical axis. Be sure to identify the intercept values on your graphs.
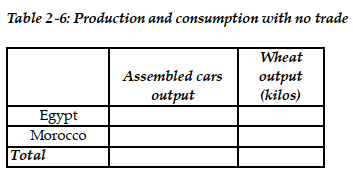
b. Suppose each country allocates 60% of its labor hours to wheat production and 40% to the production of assembled cars. Complete Table 2-6 below to show each country's output of the two products.
 c. If the two countries do not trade and consume whatever they produce, identify the current production and consumption point for each country on their respective production possibilities frontiers. Label Egypt's consumption point "C" and Morocco's consumption point "K".
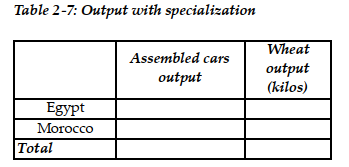
d. Suppose the two countries specialize and trade. Who should produce assembled cars and who should produce wheat? Explain your answer.
e. Complete Table 2-7 below to show each country's output with specialization.
 f. Did specialization increase the combined output for the two countries without any increase in resources? If so, by how much?
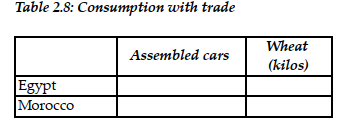
g. Suppose Egypt and Morocco agree to trade so that in exchange for 1,200 kilos of wheat, the exporter of wheat receives 48 cars. Complete Table 2.8 below to show each country's consumption bundle after trade.
 h. Show the consumption points after trade on each country's production possibilities frontier. Label these points "B" for Egypt and "J" for Morocco.
i. Has trade made the two countries better off? Explain your answer.
Correct Answer:
Verified
d. Egyp...
View Answer
Unlock this answer now
Get Access to more Verified Answers free of charge
Q6: Mobica provides car furniture to Daimler and
Q7: Which of the following statements is NOT

