The neutron-proton stability curve of the isotopes of all elements will be plotted on a graph whose axes are shown in Figure 29-1.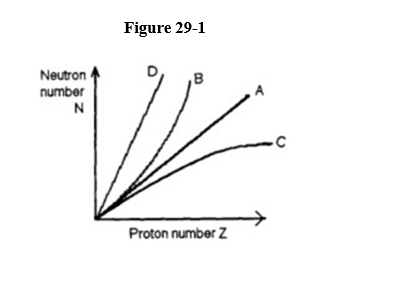
The plot will look like
A) graph A.
B) graph B.
C) graph C.
D) graph D.
Correct Answer:
Verified
Q24: Carbon-14 dating can reliably date ancient archeological
Q25: What happens to the half-life of a
Q26: The binding energy of most nuclei is
Q27: Which of the following is NOT a
Q28: The binding energy per nucleon
A) is approximately
Q30: Stable nuclei with mass numbers greater than
Q31: Which of the following combinations of nucleons
Q32: A roentgen (R) is
A) a dosage of
Q33: A rad is
A) a dosage of 2.58
Q34: A gray (Gy) is
A) the SI unit
Unlock this Answer For Free Now!
View this answer and more for free by performing one of the following actions

Scan the QR code to install the App and get 2 free unlocks

Unlock quizzes for free by uploading documents