The graph shown in Figure 27-1 is a plot based on student data from their testing of a
photoelectric material.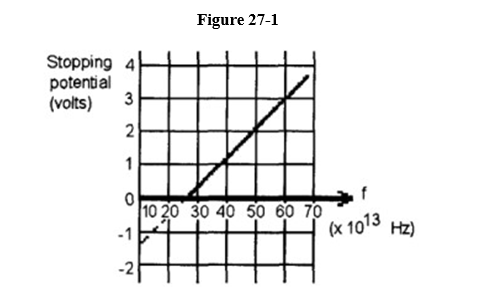
(a) Determine the cutoff frequency.
(b) Determine the work function.
Correct Answer:
Verified
View Answer
Unlock this answer now
Get Access to more Verified Answers free of charge
Q42: The word LASER is an acronym for
A)
Q43: In a He-Ne laser, the actual emission
Q44: The compact disc stores information by means
Q45: When a hologram is illuminated with a
Q46: The human eye can just detect green
Q48: What is the radius of the electron
Q49: What is the ionization energy for a
Q50: What is the energy, in eV, of
Q51: Bohr's atomic theory predicted energy levels for
Q52: If sunlight peaks at 0.55 ?m wavelength,
Unlock this Answer For Free Now!
View this answer and more for free by performing one of the following actions

Scan the QR code to install the App and get 2 free unlocks

Unlock quizzes for free by uploading documents