Shown in Figure 13-3 is a graph of position vs. time for a system undergoing simple harmonic motion. Which of the other graphs represents the system's acceleration as a function of time?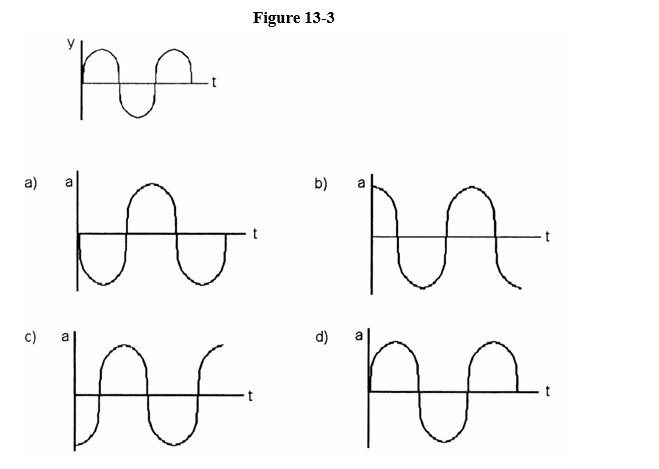
Correct Answer:
Verified
Q1: Does Simple Harmonic Motion occur when the
Q2: What is the equation of motion of
Q3: SHM may be written y = A
Q4: Spock has landed on a newly discovered
Q6: How would you "weigh" the astronauts in
Q7: Imagine hitting a heavy anvil with a
Q8: Name 5 different type of waves or
Q9: Why can longitudinal earthquake waves go straight
Q10: When the speed of a wave depends
Q11: The condition of driving a system at
Unlock this Answer For Free Now!
View this answer and more for free by performing one of the following actions

Scan the QR code to install the App and get 2 free unlocks

Unlock quizzes for free by uploading documents