Shown in Figure 13-2 is a graph of position vs. time for a system undergoing simple harmonic motion. Which of the other graphs represents the system's velocity as a function of time?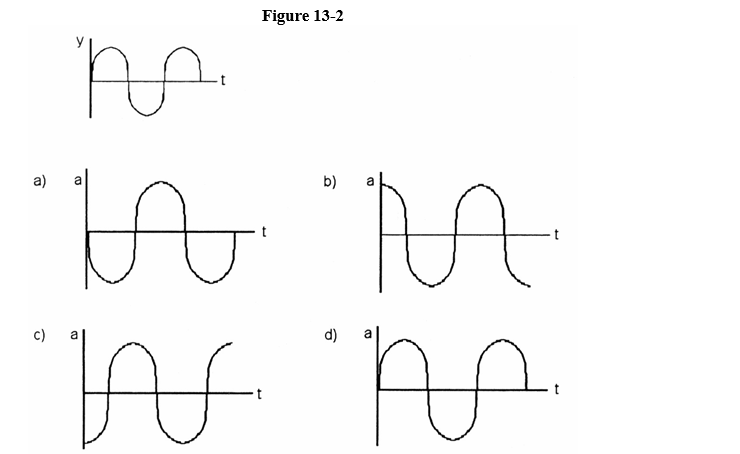
A) graph a
B) graph b
C) graph c
D) graph d
Correct Answer:
Verified
Q18: A mass swinging on the end of
Q19: Doubling only the amplitude of a vibrating
Q20: Simple pendulum A swings back and forth
Q21: When the mass of a simple pendulum
Q22: When the length of a simple pendulum
Q24: Simple pendulum A swings back and forth
Q25: What happens to a simple pendulum's frequency
Q26: Increasing the mass m of a mass-and-spring
Q27: Increasing the spring constant k of a
Q28: Consider the wave shown in Figure 13-4
Unlock this Answer For Free Now!
View this answer and more for free by performing one of the following actions

Scan the QR code to install the App and get 2 free unlocks

Unlock quizzes for free by uploading documents