Multiple Choice
Which of the following graphs illustrates the growth curve of a population of snowshoe hares over several seasons in northern Canada?
A) 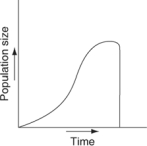
B) 
C) 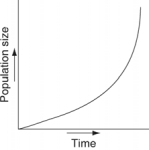
D) 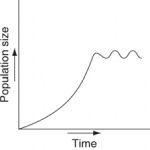
E) 
Correct Answer:
Verified
Related Questions
Q15: Q16: Review the roles of RNA by filling Q17: Exponential growth of a population is Q18: Logistic growth of a population is Q19: Which of the following graphs refer Q20: Which of the following graphs illustrates the Q22: When levels of CO2 are experimentally increased,![]()
Unlock this Answer For Free Now!
View this answer and more for free by performing one of the following actions

Scan the QR code to install the App and get 2 free unlocks

Unlock quizzes for free by uploading documents