The following figure represents the cost and revenue curves of a firm that is producing a service in a monopoly market.
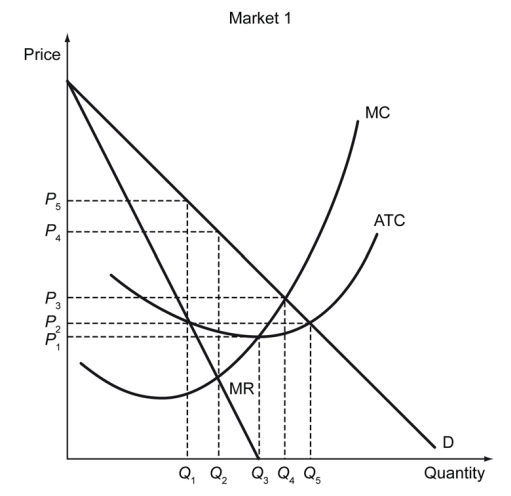
-Refer to the figure above. What is the optimal quantity that the monopolist should produce?
A) Q1
B) Q2
C) Q4
D) Q5
Correct Answer:
Verified
Q1: U.S. Code Title 18 § 1696 states
Whoever
Q2: U.S. Code Title 18 § 1696 states
Whoever
Q3: Firm A is a monopoly because of
Q4: When a monopolist charges $10 for its
Q6: The following figure shows the demand curve
Q7: Tobac Co. is a monopolist in cigarette
Q8: Economist Reuben Kessel wrote an influential article
Q9: Peak-load pricing is when a firm charges
Q10: Tobac Co. is a monopolist in cigarette
Q11: What makes World's Fair of 1876, in
Unlock this Answer For Free Now!
View this answer and more for free by performing one of the following actions

Scan the QR code to install the App and get 2 free unlocks

Unlock quizzes for free by uploading documents