The figure below shows the demand and the supply in a market before and after a tax is imposed. The demand and the supply curves are straight lines.
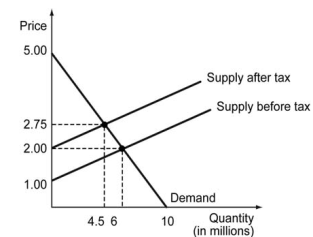
-Refer to the figure above. What is the deadweight loss due to this tax?
A) $500,000
B) $750,000
C) $1,000,000
D) Not enough information to compute the answer
Correct Answer:
Verified
Q5: The table below shows the tax brackets
Q6: The table below shows the tax brackets
Q7: The table below shows the tax brackets
Q8: The following figure shows the supply and
Q9: The market for a particular video game
Q11: The table below shows the reservation values
Q12: The table below shows the reservation values
Q13: The table below shows the reservation values
Q14: The following figure depicts two industries, each
Q15: Approximately 80 percent of mothers of infants
Unlock this Answer For Free Now!
View this answer and more for free by performing one of the following actions

Scan the QR code to install the App and get 2 free unlocks

Unlock quizzes for free by uploading documents