The following figure shows credit demand and credit supply curves.
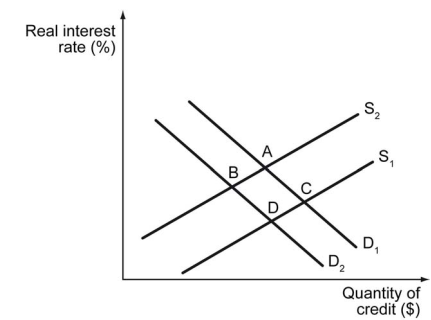
-Refer to the figure above. Assume that the loanable funds market initially is in equilibrium at point A. The media report that a new housing bubble may warrant precaution. Holding all else constant, how might the equilibrium change?
A) Demand will increase, so people can pay off their houses faster. The new equilibrium will be at point C.
B) Supply will increase, because potential buyers will choose to save instead of investing. The new equilibrium will be at point C.
C) Demand will decrease, because potential buyers may fear stricter requirements to qualify for loans and so choose to not buy a house yet. The new equilibrium will be at point B.
D) Supply will decrease, because banks are less likely to approve new loans. The new equilibrium will be at point B.
Correct Answer:
Verified
Q12: The table below shows the reservation values
Q13: The table below shows the reservation values
Q14: The following figure depicts two industries, each
Q15: Approximately 80 percent of mothers of infants
Q16: Historically, participation in employer-sponsored retirement saving programs
Q18: The following table shows a T-account for
Q19: The following table shows Free Donut Bankʹs
Q20: The following table shows Free Donut Bankʹs
Q21: The following table shows the assets and
Q22: Alpha Bank has $100,000 in total assets
Unlock this Answer For Free Now!
View this answer and more for free by performing one of the following actions

Scan the QR code to install the App and get 2 free unlocks

Unlock quizzes for free by uploading documents