The figure below shows labor supply and labor demand curves.
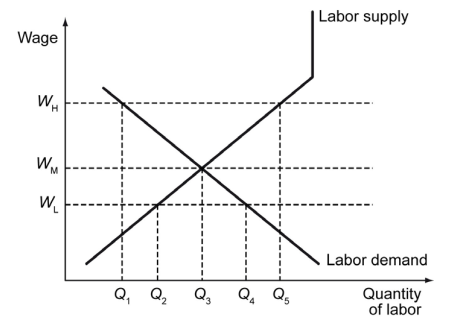
-Refer to the figure above. John's reservation wage is w1 and Joy's reservation wage is w2. Assume that a minimum wage is implemented at w1. John and Joy are both unemployed. What is true about John and Joy?
A) Joy is voluntarily unemployed, and John is involuntarily unemployed.
B) John is voluntarily unemployed, and Joy is involuntarily unemployed.
C) John and Joy are both voluntarily unemployed.
D) John and Joy are both involuntarily unemployed.
Correct Answer:
Verified
Q2: In 1973, economist Steven N. S. Cheung
Q3: The following excerpt is from Timothy R.
Q4: In episode 12 of the sixth season
Q5: What constitutes evidence for the efficacy of
Q6: The following table defines some population statistics
Q7: The following table defines some population and
Q8: Which of the following statements is true?
A)
Q9: Susan, Kevin, and Joshua are three individuals
Q10: Truck drivers across the country are on
Q12: The following figure illustrates the labor demand
Unlock this Answer For Free Now!
View this answer and more for free by performing one of the following actions

Scan the QR code to install the App and get 2 free unlocks

Unlock quizzes for free by uploading documents