The diagram below shows the demand curve, supply curve, and the marginal social cost curve for a manufacturing unit.
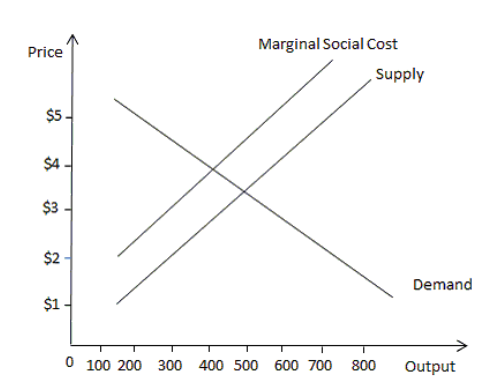
-Refer to the scenario above. The equilibrium output produced in the market is______ units
A) 300
B) 400
C) 500
D) 600
Correct Answer:
Verified
Q26: Which of the following is an example
Q27: In which of the following cases will
Q28: The production of a good generates a
Q29: The production of a good generates a
Q30: The production of a good generates a
Q32: The diagram below shows the demand curve,
Q33: The diagram below shows the demand curve,
Q34: The diagram below shows the demand curve,
Q35: The figure below shows the marginal social
Q36: The figure below shows the demand, supply
Unlock this Answer For Free Now!
View this answer and more for free by performing one of the following actions

Scan the QR code to install the App and get 2 free unlocks

Unlock quizzes for free by uploading documents