The figure below shows the marginal social cost (MSC) curve, marginal private cost (MPC) curve and demand (D) curve for a good.
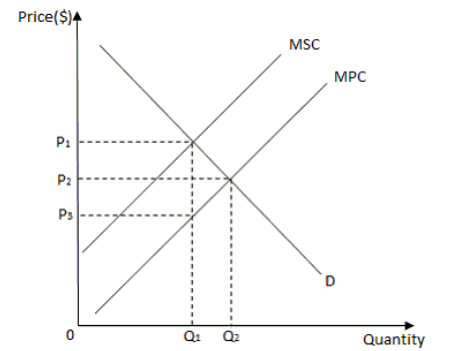
-Refer to the figure above. Which of the following is true in this case?
A) The production of the good involves a positive externality.
B) The production of the good involves a negative externality.
C) The production of the good is subsidized by the government.
D) The production of the good in the competitive market leads to a net increase in total surplus.
Correct Answer:
Verified
Q30: The production of a good generates a
Q31: The diagram below shows the demand curve,
Q32: The diagram below shows the demand curve,
Q33: The diagram below shows the demand curve,
Q34: The diagram below shows the demand curve,
Q36: The figure below shows the demand, supply
Q37: The figure below shows the demand, supply
Q38: The figure below shows the marginal pollution
Q39: The figure below shows the marginal pollution
Q40: The figure below shows the marginal pollution
Unlock this Answer For Free Now!
View this answer and more for free by performing one of the following actions

Scan the QR code to install the App and get 2 free unlocks

Unlock quizzes for free by uploading documents