Use the following to answer the questions below:
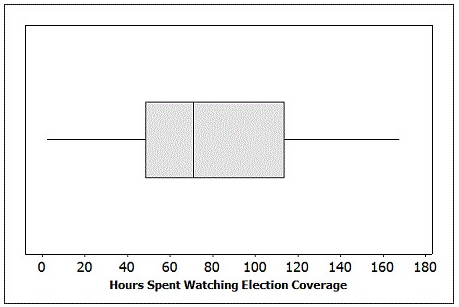
Many major television networks air coverage of the incoming election results during primetime hours. The provided boxplot displays the amount of time (in minutes) spent watching election coverage for a random sample of 25 U.S. adults. In this sample, the average time spent watching election coverage was 80.44 minutes with standard deviation of 43.99 minutes.
-Is it reasonable to use the t-distribution to construct a confidence interval for the average amount of time spent watching election coverage by U.S. adults?
Correct Answer:
Verified
Q70: Use the following to answer the questions
Q71: Use the following to answer the questions
Q72: Use the following to answer the questions
Q73: Use the following to answer the questions
Q74: Use the following to answer the questions
Q76: Use the following to answer the questions
Q77: Use the following to answer the questions
Q78: Use the following to answer the questions
Q79: Use the following to answer the questions
Q80: Use the following to answer the questions
Unlock this Answer For Free Now!
View this answer and more for free by performing one of the following actions

Scan the QR code to install the App and get 2 free unlocks

Unlock quizzes for free by uploading documents