Which of the following figures best illustrates the relationship between average total cost and marginal cost? 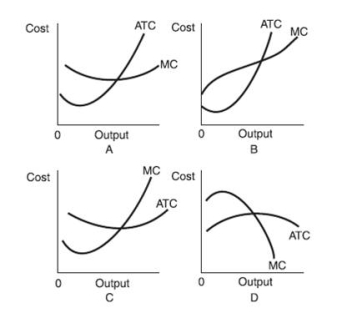
A) Figure A.
B) Figure B.
C) Figure C.
D) Figure D.
Correct Answer:
Verified
Q93: Q94: In the short run, total cost increases: Q95: At high levels of production in the Q96: In the range of outputs where the Q97: If the marginal cost curve is above Q99: If average total cost is greater than Q100: If a firm's average total cost and Q101: Typically, as the level of output increases Q102: Which of the following statements is true? Q103: Short-run costs behave as they do because![]()
A)
A)
Unlock this Answer For Free Now!
View this answer and more for free by performing one of the following actions

Scan the QR code to install the App and get 2 free unlocks

Unlock quizzes for free by uploading documents