Use the following figure.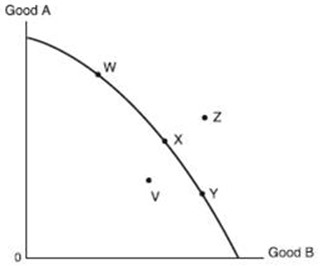
-If there were an increase in the number of workers in the economy represented in the production possibilities figure, the production possibilities curve would:
A) remain where it is.
B) shift inward to the left.
C) shift outward to the right.
D) slope upward to the right.
Correct Answer:
Verified
Q107: Use the following figure. Q108: Use the following figure. Q109: Use the following figure. Q110: Use the following figure. Q111: Use the following figure. Q113: Use the following figure. Q114: Use the following figure. Q115: Use the following figure. Q116: Unemployment can be represented on a production Q117: Economic growth is illustrated using a production Unlock this Answer For Free Now! View this answer and more for free by performing one of the following actions Scan the QR code to install the App and get 2 free unlocks Unlock quizzes for free by uploading documents![]()
![]()
![]()
![]()
![]()
![]()
![]()
![]()

